
“How can I find the formula for a graph on excel”
— Anonymous question
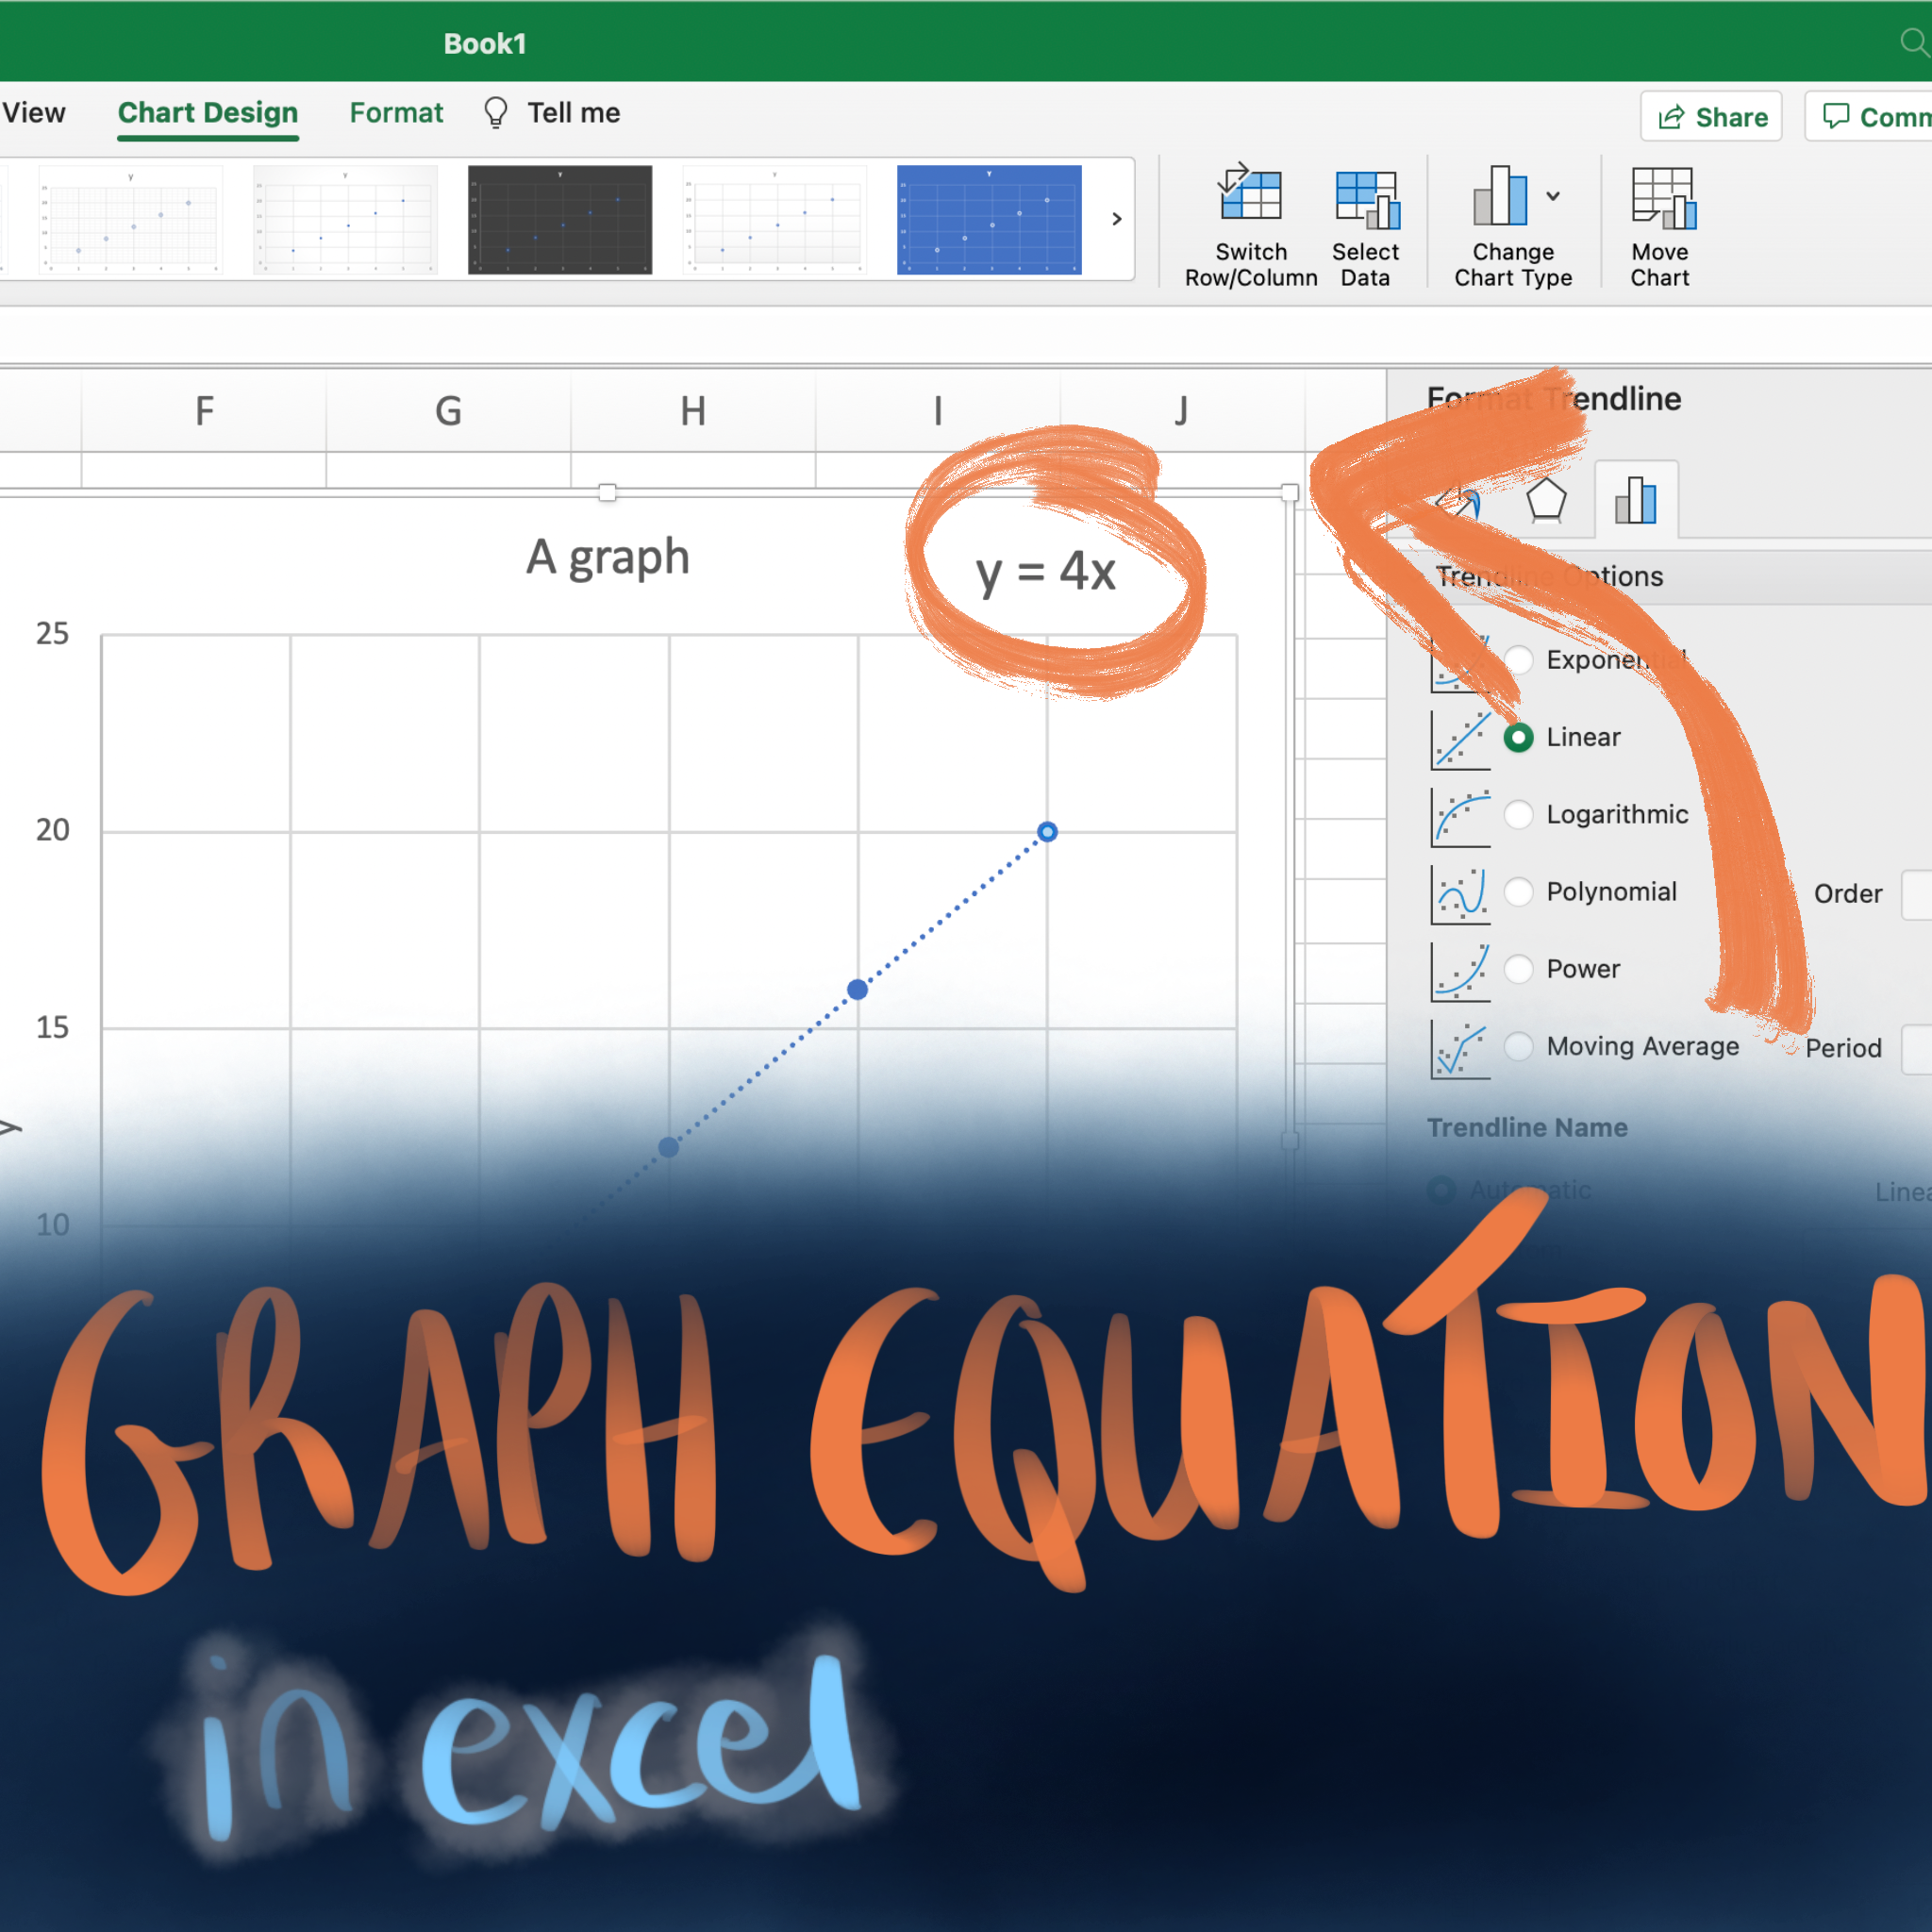
- Select the data points, insert and scatter. (For this to work, it has to be a scatter graph )
- Click on the chart and navigate to the tab chart design. Click add chart element, trendline and select the type of graph you have.
- Right click on the trendline and format trendline. Make sure you’re on the trendline options tab of the menu that pops up (it has an icon of bars).
- Click the checkbox saying “display equation on chart”.

Leave a Reply